
Why Choose the Right Machining Tools for Your Business?
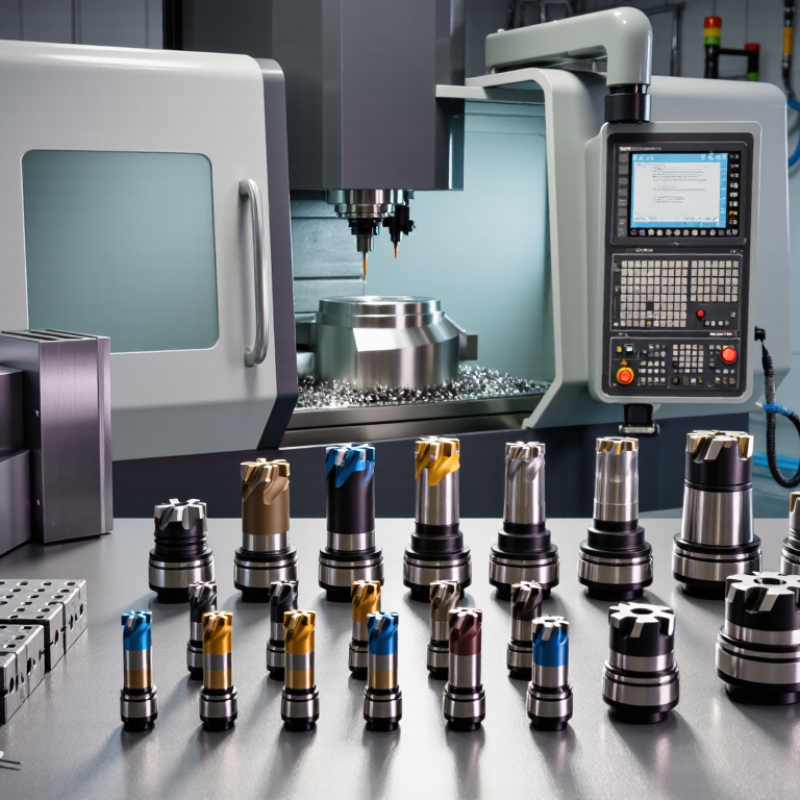
Choosing the right machining tools can shape a workshop’s productivity, accuracy, and long-term costs. A tool may look affordable, yet poor performance can create scrap, vibration, downtime, and frustrated operators. The right choice depends on material, machine capability, cutting parameters, part design, and production volume. It is rarely a simple catalogue decision.
In a busy machine shop, a suitable carbide end mill can leave clean edges on hardened steel while maintaining stable cutting forces. An unsuitable tool may chatter within minutes. Small details matter. Coating type, flute geometry, tool diameter, coolant delivery, and holder runout can all influence results. Experienced machinists usually compare manufacturer data with actual test cuts, rather than trusting advertising claims alone. Measurements from surface-finish checks, tool-life records, and dimensional inspections provide stronger evidence.
Cost still matters, but the cheapest option is not always economical. A tool that lasts twice as long may reduce setup changes and protect delivery schedules. However, longer life should not excuse poor accuracy or unsafe operating practices. Every workshop has different equipment, skills, and quality requirements. That makes careful evaluation essential.
There is no perfect tool.
Even reliable recommendations may need adjustment after real production begins. Material batches change. Machines age. Operators develop different cutting habits. Reviewing results honestly helps businesses refine their process. By selecting machining tools through documented testing, technical guidance, and practical experience, companies can improve consistency without chasing unrealistic promises. The decision becomes more than a purchase. It becomes an investment in dependable manufacturing.
Define Machining Goals Using ISO 2768 Tolerances and Ra Surface Values
Choosing the right machining tools starts with a clear definition of quality. ISO 2768 tolerances can establish practical limits for dimensions without individual tolerance notes. However, they should not replace functional tolerances on critical fits, holes, or sealing surfaces. A drawing marked with ISO 2768-mK still requires careful interpretation. Confirm the applicable tolerance class and drawing revision before selecting cutting tools.
Surface requirements need equal attention. Ra values describe average surface roughness, usually in micrometres. A target of Ra 6.3 may suit a rough machined face, while Ra 1.6 or lower often requires a controlled finishing operation. Tool geometry, feed rate, cutting speed, machine rigidity, and workpiece material all affect the result. A sharp finishing tool may reduce marks, but excessive tool pressure can create vibration. Small details matter.
Measure the part after machining. Use calibrated gauges for dimensions and a suitable roughness tester for Ra verification. Record temperature and measurement direction when results seem inconsistent. In practical workshops, operators sometimes chase a low Ra value while missing an important dimensional tolerance. That is an expensive lesson. Tool selection should balance tolerance control, surface quality, cycle time, and inspection effort. The ideal process is not always the fastest one. Even experienced teams should review failed parts, because a perfect-looking surface can hide poor geometry.
Why Choose the Right Machining Tools for Your Business? - Define Machining Goals Using ISO 2768 Tolerances and Ra Surface Values
Practical machining-goal guide for selecting tools, processes, tolerances, and surface-finish targets
| Machining Goal | Typical Feature Size | ISO 2768-1 Class | General Linear Tolerance | Target Ra | Recommended Tool or Process | Quality-Control Method |
|---|---|---|---|---|---|---|
| Fast, economical rough machining | 30–120 mm | ISO 2768-c | ±0.5 mm | 6.3–12.5 µm | High-feed milling cutter, rough-turning insert, or large-chip drill | Caliper or steel rule for preliminary dimensional checks |
| General-purpose production machining | 30–120 mm | ISO 2768-m | ±0.3 mm | 3.2–6.3 µm | General-purpose carbide end mill, turning insert, or standard twist drill | Calibrated vernier caliper, micrometer, and visual edge inspection |
| Improved fit between mating components | 6–30 mm | ISO 2768-m | ±0.2 mm | 1.6–3.2 µm | Finishing end mill, fine-turning insert, or finish boring tool | Outside micrometer, bore gauge, and controlled fit verification |
| Smooth sliding or rotating contact surface | 6–30 mm | ISO 2768-f | ±0.1 mm | 0.8–1.6 µm | Fine-finishing insert, reamer, precision boring tool, or light grinding operation | Micrometer, bore gauge, and calibrated surface-roughness tester |
| Precision location and repeatability | 30–120 mm | ISO 2768-f | ±0.15 mm | 1.6–3.2 µm | Rigid carbide finishing tool, precision reamer, or finish boring cycle | Height gauge, dial indicator, coordinate measuring machine, or gauge fixture |
| High-quality sealing or bearing interface | 30–120 mm | ISO 2768-f | ±0.15 mm | 0.4–0.8 µm | Precision turning followed by grinding, honing, or other dedicated finishing process | Micrometer, roundness check, surface-roughness tester, and functional leak or fit test |
| Small-hole accuracy and repeatable diameter | 3–6 mm | ISO 2768-f | ±0.05 mm | 1.6–3.2 µm | Solid-carbide drill followed by a reamer when the design requires a controlled hole size | Pin gauges, plug gauges, bore gauge, and visual burr inspection |
| Large structural or non-critical features | 120–400 mm | ISO 2768-c | ±1.2 mm | 6.3–12.5 µm | Robust roughing cutter, face mill, or heavy-duty turning tool | Tape measure, caliper, height gauge, and fixture-reference inspection |
Technical Notes
- ISO 2768-1 general linear tolerances apply only when individual dimensional tolerances are not specified on the technical drawing.
- For the nominal size range of 6–30 mm, ISO 2768-1 gives ±0.2 mm for class m, ±0.1 mm for class f, ±0.2 mm for class c, and ±0.5 mm for class v.
- For the nominal size range of 30–120 mm, ISO 2768-1 gives ±0.3 mm for class m, ±0.15 mm for class f, ±0.3 mm for class c, and ±0.8 mm for class v.
- For the nominal size range of 120–400 mm, ISO 2768-1 gives ±0.5 mm for class m, ±0.2 mm for class f, ±0.5 mm for class c, and ±1.2 mm for class v.
- Ra values are arithmetic-average surface-roughness targets. Actual results depend on material, tool geometry, cutting speed, feed rate, rigidity, coolant, tool wear, and the selected machining process.
- Surface finish requirements and geometric tolerances should be stated separately when the part function requires limits tighter than the selected general tolerance class.
Related Posts
-
Exploring the Future of Precision Engineering with CNC Turning Machines
-
Top 10 CNC Tools for Global Buyers How to Choose the Best?
-

Top CNC Tools 2026 Trends for Global Buyers?
-
China Top 10 CNC Machining Parts for Global Buyers?
-

Why Choose a CNC Mill for Your Manufacturing Needs?
-
Unlocking Precision: How CNC Machining Parts are Revolutionizing Modern Manufacturing